Cottesloe wave data
Find out about wave data at Cottesloe, including current and historical wave directions, and significant wave heights.
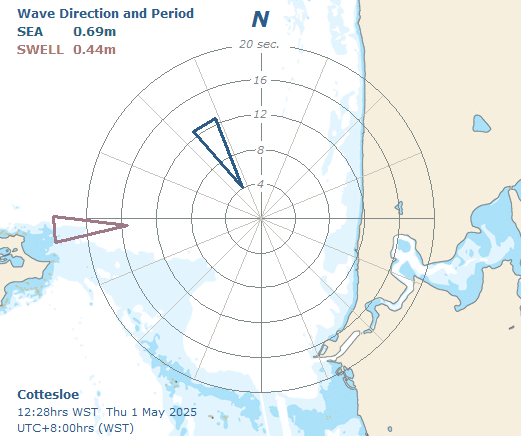
Cottesloe sea and swell directional graph
The bearing of the arrow indicates the direction of the sea and swell. The point of the arrow indicates the period of the sea and swell.

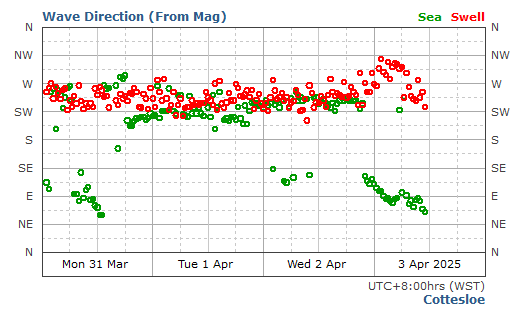
Cottesloe historical wave direction graph
The coloured circles indicate the changes in sea and swell direction over time.

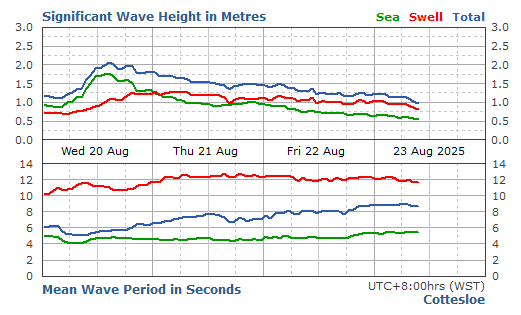
Cottesloe significant wave height graph
The significant wave height is the average height of the highest one third of waves recorded. It is often the wave height reported by an experienced observer.


